Subplots in subplots
Verfasst: Donnerstag 11. Mai 2017, 20:59
Hallo zusammne,
ich würde gerne 2x3 subplots erstellen, wobei jeder subplot wiederum aus drei subplots besteht.
In Bildern:
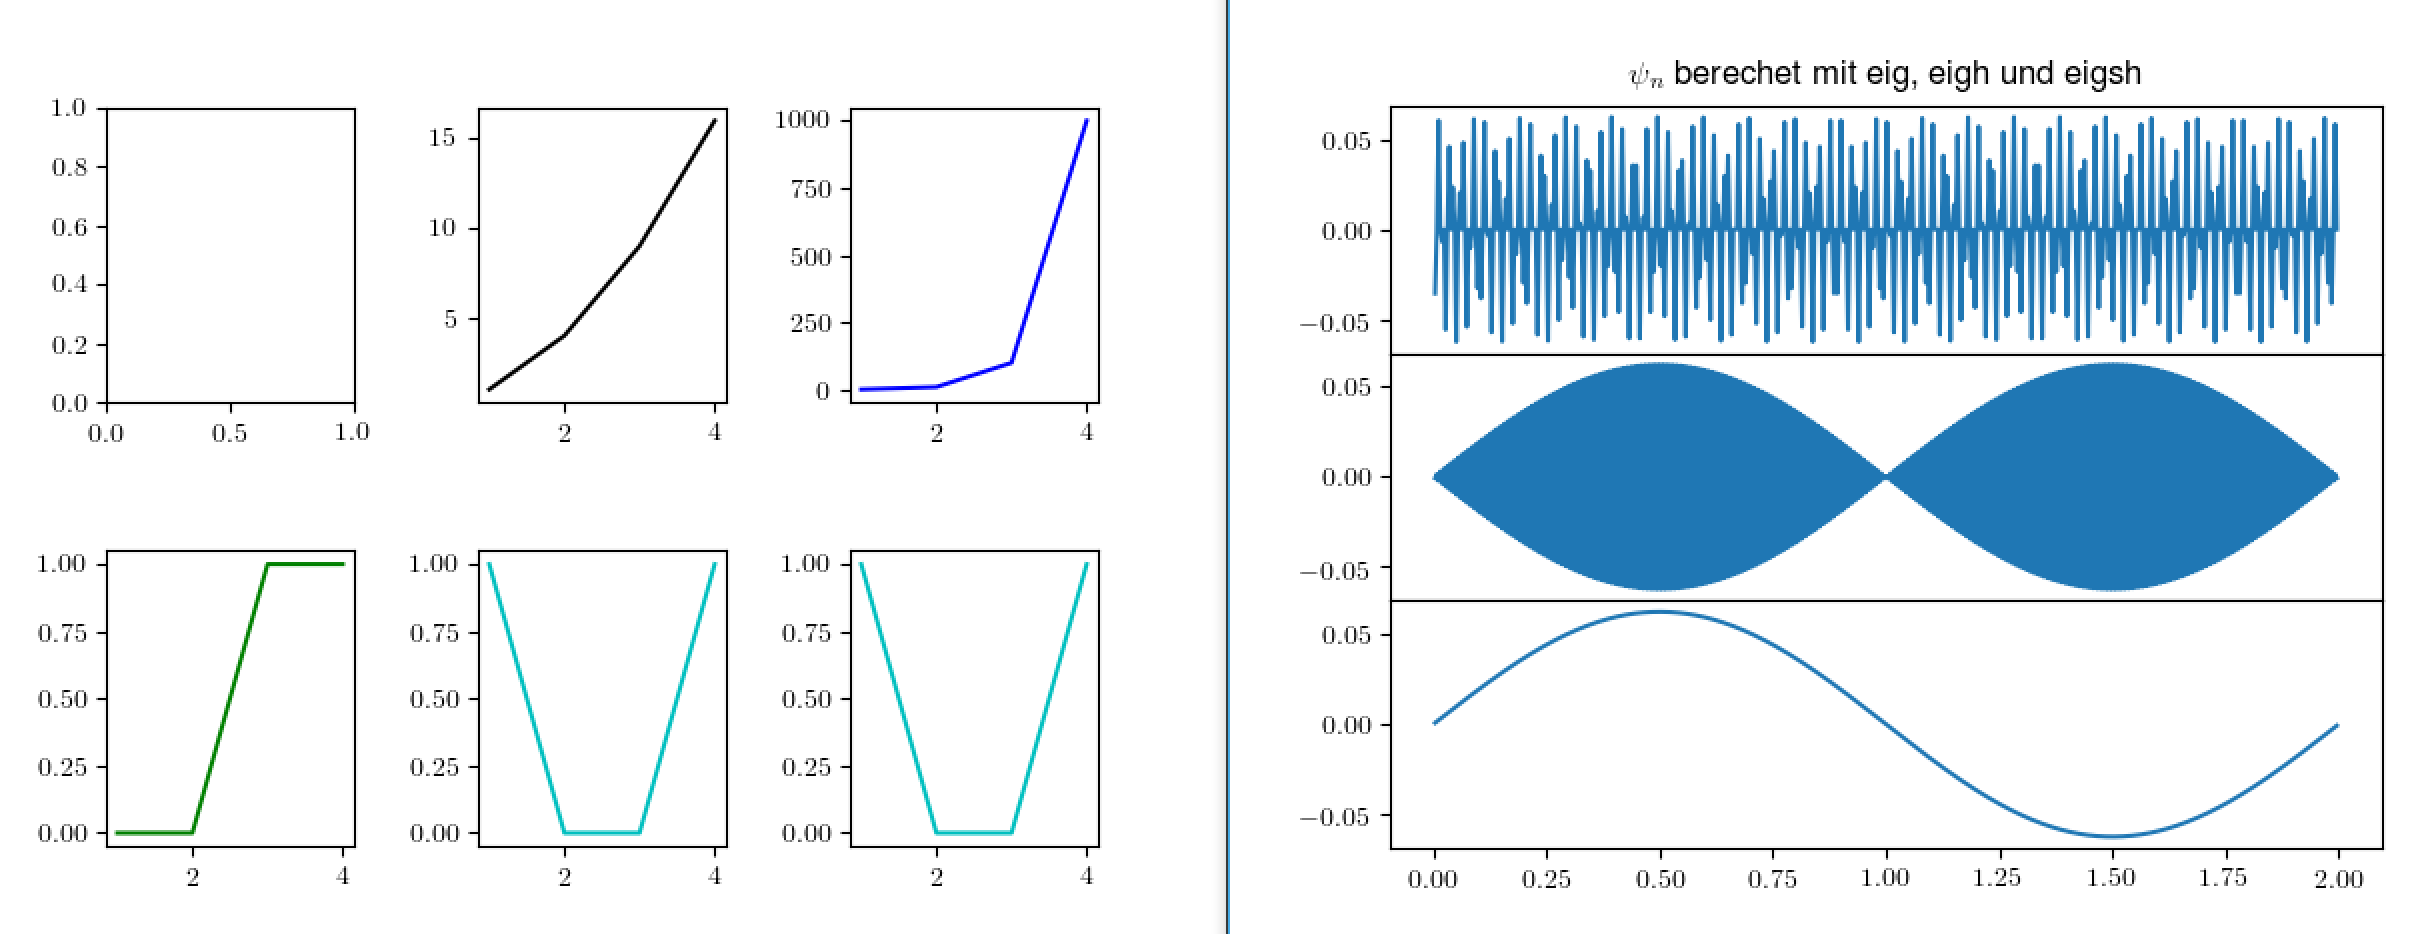
Es sollen also sechs Bilder wie rechts, an die jeweiligen Stellen im linken Bild gelegt werden. Die Funktionen im linken Bild sind völlig willkürlich und sollen nur zur Illustration dienen.
Der Code den ich soweit habe ist:
Wäre für ein bisschen Hilfe dankbar.^^
Gruss Sito
ich würde gerne 2x3 subplots erstellen, wobei jeder subplot wiederum aus drei subplots besteht.
In Bildern:
Es sollen also sechs Bilder wie rechts, an die jeweiligen Stellen im linken Bild gelegt werden. Die Funktionen im linken Bild sind völlig willkürlich und sollen nur zur Illustration dienen.
Der Code den ich soweit habe ist:
Code: Alles auswählen
#Linkes Bild
fig = plt.figure()
gs = gridspec.GridSpec(2, 3)
ax1 = fig.add_subplot(gs[0,0])

ax2 = fig.add_subplot(gs[0,1])
ax2.plot([1,2,3,4], [1,4,9,16], 'k-')
ax3 = fig.add_subplot(gs[0, 2])
ax3.plot([1,2,3,4], [1,10,100,1000], 'b-')
ax4 = fig.add_subplot(gs[1,0])
ax4.plot([1,2,3,4], [0,0,1,1], 'g-')
ax5 = fig.add_subplot(gs[1,1])
ax5.plot([1,2,3,4], [1,0,0,1], 'c-')
gs.update(wspace=0.5, hspace=0.5)
ax5 = fig.add_subplot(gs[1,2])
ax5.plot([1,2,3,4], [1,0,0,1], 'c-')
gs.update(wspace=0.5, hspace=0.5)

#Rechtes Bild
fig, (ax1, ax2, ax3) = plt.subplots(3, sharex=True, sharey=True)

ax1.plot (x[1: -1] , ev[:,1], label =r"$\psi_{%d}(x)$" % i)
ax1.set_title(r'$\psi_n$ berechet mit eig, eigh und eigsh')
ax2.plot (x[1: -1] , evh[:,1], label =r"$\psi_{%d}(x)$" % i)
ax3.plot (x[1: -1] , evs[:,1], label =r"$\psi_{%d}(x)$" % i)

fig.subplots_adjust(hspace=0)
plt.setp([a.get_xticklabels() for a in fig.axes[:-1]], visible=False)
Gruss Sito