https://imgur.com/a/DUCFu
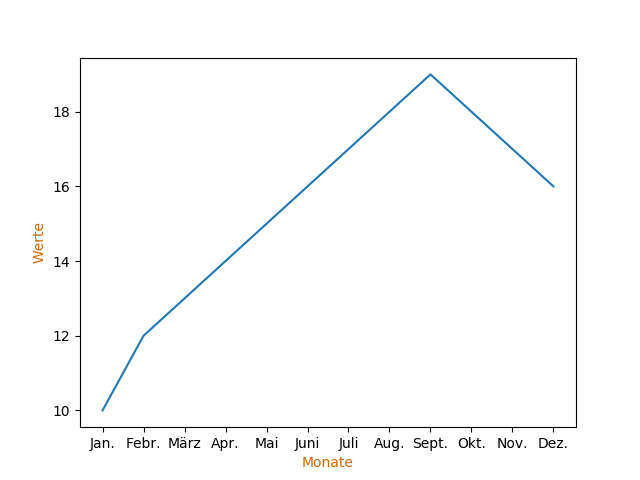
Statt der Nummern sollten da die Monate Apri(4,0), Mai(5,0) und Juni(6,0) stehen. 3,5, 4,5 usw. sollten ausgeblendet sein.
Der Code sieht wie folgt aus:
Code: Alles auswählen
df=pd.read_csv('df.csv', sep=',',index_col=0)

y1 = df.A
y2 = df.B
x = df.index

x_start = 3.5
x_end = 6.5
x = np.linspace(x_start, x_end, len(y1))

fig, ax1 = plt.subplots()

ax2 = ax1.twinx()
ax1.plot(x, y1, '-',c='xkcd:dull blue')
ax1.fill_between(x, 0, y1, alpha=.3)
ax2.plot(x, y2, '-',c='xkcd:red')

ax1.set_ylabel('A', color='xkcd:dull blue')
ax2.set_ylabel('B', color='xkcd:red')

plt.xticks()
plt.show()